
How to track time on issues
Eight hours logged on a ticket estimated at three. Nobody noticed until sprint review, because the number sat in a field no one opened. If you have run more than a couple of sprints you have lived some version of this. The estimate said one thing, reality said another, and the gap only surfaced when it was too late to do anything about it.
That gap is the whole point of time tracking on issues, estimate vs spent. The estimate is a bet you make when you pick up the work. The spent hours are what actually happened. Put the two side by side and you learn something no single number tells you: whether your team's estimates hold up, and where they consistently do not.
This guide walks through how Utter handles it, on one issue and rolled up across a project. You will set an estimate and log time from the Time card, read the budget bar and its color staging, set a completion percentage that drives the Gantt bar, and watch it all add up on the Project Summary. You will also learn the honest limits, because a few are worth knowing before you build a habit around them.
Why estimate vs spent is worth tracking at all
An estimate on its own is a guess with no feedback loop. You say "this is about three hours," you do the work, and unless you write down what it actually took, you never find out if three was right. Next time a similar task lands, you guess again from the same blind spot.
Spent time closes that loop. When you record that the three-hour task took eight, you are not just filling in a field. You are building the one piece of data that tells you your estimates for that kind of work run low by more than double.
Do that across a sprint and the patterns surface. Bug fixes come in fine. Anything touching the schema takes three times what anyone predicts. That is the real value of tracking time on issues, estimate vs spent. Not the individual numbers, the pattern underneath them.
Utter does this per issue, with a number you type in yourself. There is no running clock. You estimate when you pick the work up, and you update the spent figure as you go.
Throughout the guide I will use the demo project, key WEB, with its board columns Backlog, To Do, In Progress, In Review, and Done. Picture a real ticket in it, something like "Timeline + Summary tab," the kind of feature work that is easy to underestimate because it touches more than it looks like it will.
Where time tracking on issues lives: the Time card
Open any issue and look at the right rail. That column holds the issue's metadata: assignee, status, dates, and near them a card labelled Time. It holds three things, and knowing what each one is for is most of the battle.
At the top are two number fields, Estimate (h) and Spent (h). Below them, once there is an estimate to measure against, a Budget bar. At the bottom, a Completion slider with a live percentage readout. That is the whole card. Three controls, three distinct jobs: what you think it will take, what it has taken, and how done it is.
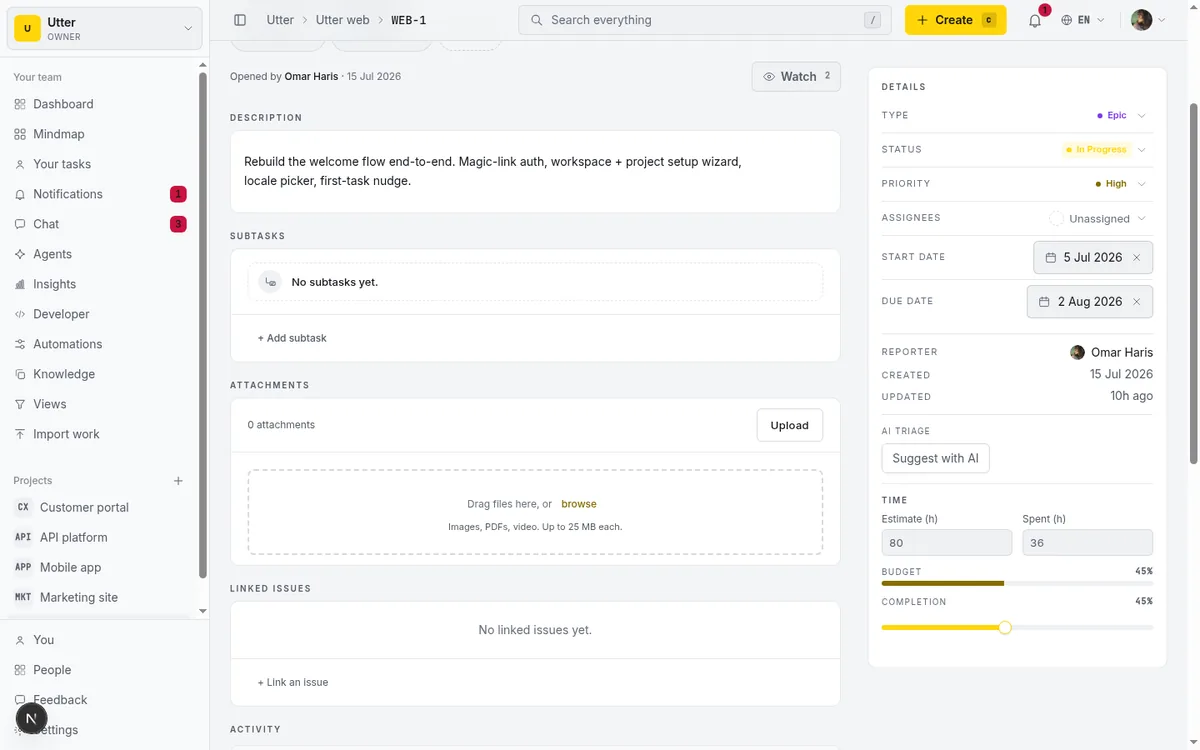
Keeping these in the right rail is deliberate. Time is metadata about the issue, so it lives next to the other metadata, not buried in the description or a separate tab. You glance at the card while you are looking at the ticket anyway. Nothing to open, nothing to expand.
Setting an estimate and logging spent hours
Both fields take hours. Not minutes. Decimals are fine, so 2 is two hours and 1.5 is an hour and a half.
Type the number and click away. There is no save button. Each field commits when it loses focus (on blur), so tabbing to the next control or clicking elsewhere on the page is what writes the value.
Here is the part worth knowing. Under the hood Utter stores minutes, not hours. When you type 1.5 into Estimate (h) it converts to 90 and saves that to estimate_minutes (the math is literally hours times 60, rounded). Same for Spent, which lands in spent_minutes. You never see or type minutes in the interface. You work in hours; the database keeps minutes. This matters later when you read time back through the API, where the fields come out in minutes.
flowchart LR
    A["UI input: 1.5 hours"] --> B["Stored: estimate_minutes = 90"] --> C["API reads back: 90 minutes"]
A worked example on a WEB ticket. Say you pick up "Timeline + Summary tab." You reckon it is about three hours, so you type 3 into Estimate (h) and click away. That is your bet on record.
Two hours into the work you have not finished, but you want the number current, so you type 2 into Spent (h). The estimate stays at 3, the spent reads 2, and the budget bar (more on it next) shows you two-thirds through your budget with work still to do.
Cleared a field by mistake, or want to remove a value? Empty it and click away. An empty field saves as null, not zero, so the estimate genuinely goes back to unset rather than reading "0 hours."
What good looks like here is simple. Estimate once, when you actually pick the work up and have looked at it enough to have an opinion. Then update spent as you go, or at least at the end of a working session, so the number is not a wild guess reconstructed at sprint review. The whole system is only as honest as the spent figure you feed it.
Reading the budget bar: yellow, orange, over
The Budget bar does not show up until you have set an estimate above zero. That is intentional. A budget bar with no budget to measure against would be meaningless. Fill in only Spent and no bar appears, just the number.
Once there is an estimate, the bar renders as a row labelled Budget with a right-aligned percentage and a thin fill underneath. The percentage is spent divided by estimate, as a percent, capped at 100. So three hours spent against a three-hour estimate reads 100%. The number deliberately never climbs above 100, which sets up the one special case below.
The color tells you the state at a glance:
- Yellow, below 80%. You are comfortably inside the estimate. Nothing to see here.
- Orange, at 80% or above. You are close to the line. Time to pay attention.
- Pink, once spent passes the estimate. You are over, and the bar says so.
stateDiagram-v2
    [*] --> Hidden: no estimate yet
    Hidden --> Yellow: estimate set
    Yellow --> Orange: spent reaches 80 percent
    Orange --> Over: spent passes estimate
    Over --> Orange: estimate raised or scope cut
When you go over budget the row does not read "150%." It shows the word Over, in pink. That is a design choice worth respecting. Past 100% the exact percentage stops being useful ("we are 217% over" is just noise), and a single clear word reads faster than a number you have to interpret.
The practical question is what to do when the bar turns orange. Orange is not a failure. It is an early warning, and it is the most useful state the bar has. It means you are at 80% of your estimate and the work is probably not 80% done.
That is the moment to make a call, before you are over, not after. Either re-estimate honestly (bump the number and note why) or cut the scope so the remaining work fits the time you have left. What you should not do is watch it slide silently to pink and explain it in retro. The point of the color is to give you the choice while you still have one.
Completion percentage is its own thing
Below the budget bar sits the Completion slider, and this is the control people most often misread. It is a separate 0 to 100% slider that moves in steps of 5 (0, 5, 10, and up), with a live monospace percentage readout beside it. Drag it, release, and it commits (on release, not on every tick as you drag, so you are not firing a save on every 5% you pass through). It writes to completion_pct.
Here is the thing to internalize. Completion is completely independent of estimate and spent. It is not derived from them. Setting spent to 8 hours does nothing to the completion slider, and dragging completion to 90% does nothing to your spent figure. They are three separate facts about the issue, and you set completion by hand based on your own judgment of how done the work is.
You can even set completion with no estimate at all. A ticket with no hours on it can still be dragged to 40% done. That is fine and often useful, because "how far along is this" and "how much time has it eaten" are genuinely different questions.
Why keep them apart? Because a task can be 90% done and 200% over budget at the same time, and both facts are true and both matter. If completion were auto-derived from spent over estimate, you would lose one of them.
You would see a bar at 100% and not know whether it meant "finished" or "out of time." Keeping completion as its own honest judgment call means the budget bar can scream "over" while completion calmly says "almost there," and you get the full picture instead of a blurred average of the two.
How completion shows up on the timeline
That completion number is not just decoration on the issue page. It surfaces on the schedule. Open the project's Timeline (the Gantt view) and each issue is a bar. Inside each bar a colored fill paints from the start edge, and the width of that fill equals the issue's completion percentage.
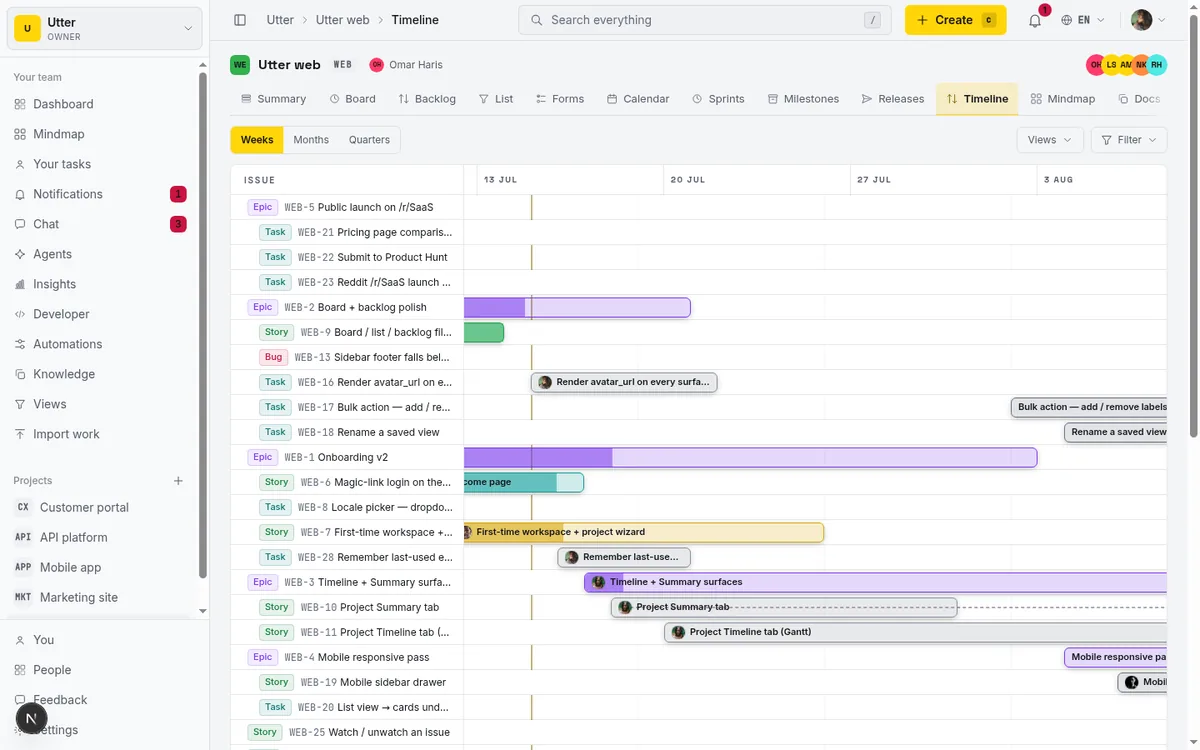
Set "Timeline + Summary tab" to 60% on the Time card and its bar on the timeline is 60% filled from the left. The fill is tinted by the issue's type and status tone, so it reads as part of the bar rather than a separate element, and the percentage is folded into the bar's accessible name so screen readers announce it too.
One clarification that prevents a real misreading. The fill is progress, not budget burned. It reflects completion_pct, the "how done is this" number, and has nothing to do with spent versus estimate. A bar can be 90% filled (nearly done) while that same issue is wildly over its time budget, because those are two different measurements and the timeline only draws the completion one. If you want to see time burn, that is the budget bar on the issue and the summary card, not the Gantt.
For everything else the timeline can do, dependencies, scheduling, drag to reschedule, see the deeper walkthrough in the Gantt chart with dependencies guide. The completion fill is one layer on top of that view.
Seeing time across the whole project
Per-issue numbers are where you enter data. The Project Summary is where it pays off. Open the summary and, provided the project has any time on it, you get a Time card with three stats: Estimated, Spent, and Remaining. These roll up every issue's hours into project totals, each rounded to a whole number of hours, with a project-wide budget fill bar underneath.
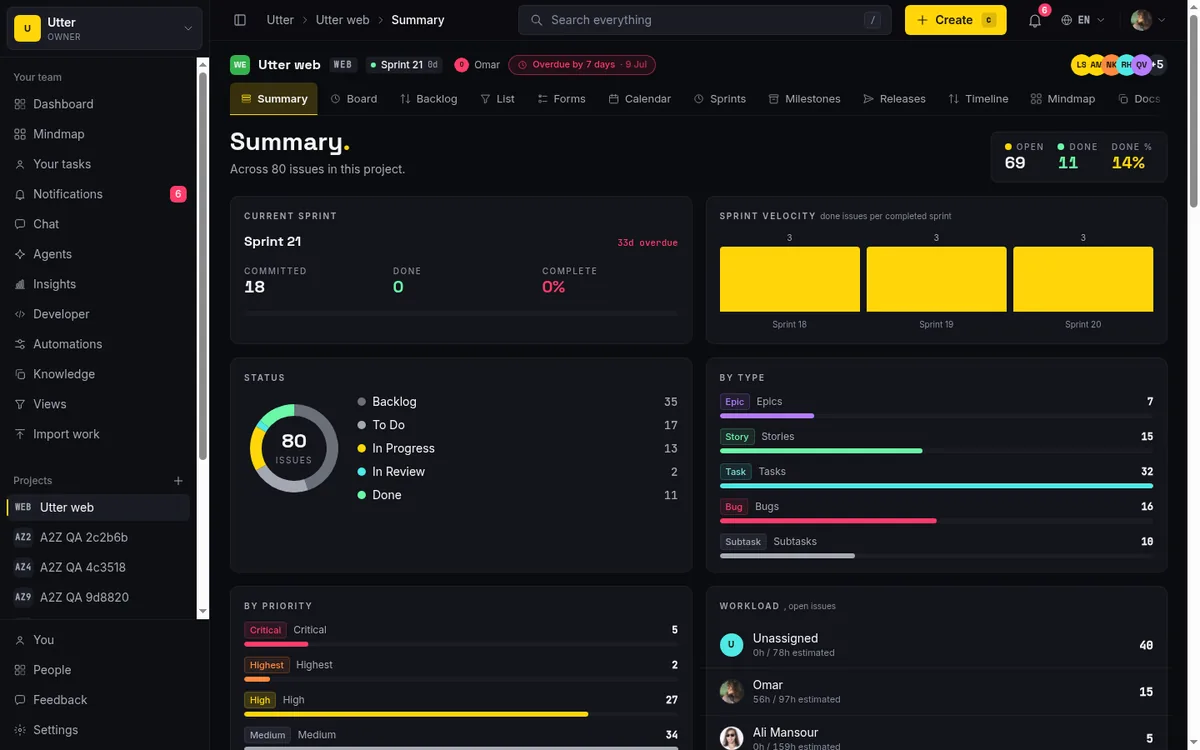
Remaining is the one to watch. It shows green while you are still inside the total estimate and flips to pink the moment total spent passes total estimate, the same over-budget signal as the per-issue bar, but for the whole project. Green remaining means the project as a whole still has budget. Pink means that, collectively, you have spent more than you planned across everything.
One quirk to know. The Time card only appears when the project's total estimate or spent is above zero, and every figure is rounded to whole hours. So a project with only a handful of small durations on it, a couple of 20-minute tasks and nothing else, might show 0h or not render the card at all. That is rounding, not a bug. The card is built for projects with real hours on them, and it comes into its own once you have logged enough to round to something meaningful.
Scroll to the Workload section on the same page and time shows up per person. For any assignee who has estimates on their issues, their row reads in the form {spent}h / {estimate}h estimated, so you can see at a glance who is running over and who has headroom. This is where the estimate-vs-spent pattern gets actionable at the team level. One person consistently over across their tickets is a signal about workload or estimation, not a one-off.
If you would rather see time inline while scanning the backlog, the List view has an optional Estimate / Spent column. It is off by default, so enable it through the column picker. Once on, each row shows the pair as durations (something like "2h" and "90m", with a dash standing in when one side is empty). Handy when you want to compare estimates across a whole list without opening each ticket. For a refresher on working in the list and other views, creating and organizing issues covers the basics.
Who can edit time, and what input gets rejected
Time is not editable by everyone who can see the issue. The controls are live only for the issue's reporter, its assignee, or a member who holds the issue.edit_any permission (internally, canEditTime). Anyone else, a viewer, or a member who is neither reporter nor assignee, sees the Time card fully but with the fields and slider disabled. They can read the estimate, spent, budget, and completion. They just cannot change them. This keeps the numbers owned by the people actually doing or accountable for the work, rather than open to edits from anyone passing through.
Input is validated. Both hour fields accept a finite number from 0 to 10000. Type something that is not a number, or a value outside that range, and Utter rejects it: a toast appears reading "Enter a positive number of hours (e.g. 2 or 1.5)." and the field snaps back to whatever was last committed. So a fat-fingered "3o" instead of "30", or a negative number, cannot land silently. You get told, and the old value is preserved. (Clearing a field to empty is allowed and saves null, as covered earlier. That is different from an invalid entry.)
Time is also readable and writable outside the interface. Over the public API and through MCP (for AI agents), the time data is exposed as a sub-resource on the issue, with snake_case fields that match the storage units. Reading it needs a key with the issues:read scope:
curl https://utter.ae/api/v1/workspaces/utter/projects/WEB/issues/WEB-12/time \
  -H "Authorization: Bearer utp_live_a1b2..."
The response comes back in minutes, not hours, because the units match the storage, not the UI:
{
  "data": {
    "issue_key": "WEB-12",
    "estimate_minutes": 180,
    "spent_minutes": 120,
    "completion_pct": 40
  }
}
Writing goes through a PATCH on the same path and needs issues:write. Send only the fields you want to change, in minutes for the two time fields and 0 to 100 for completion_pct; sending null clears a field, the same as emptying it in the UI. Here is the same update in curl, JavaScript, and Python:
curl -X PATCH https://utter.ae/api/v1/workspaces/utter/projects/WEB/issues/WEB-12/time \
  -H "Authorization: Bearer utp_live_a1b2..." \
  -H "Content-Type: application/json" \
  -d '{ "spent_minutes": 480, "completion_pct": 90 }'
const res = await fetch(
"https://utter.ae/api/v1/workspaces/utter/projects/WEB/issues/WEB-12/time",
{
method: "PATCH",
headers: {
Authorization: "Bearer utp_live_a1b2...",
"Content-Type": "application/json",
},
body: JSON.stringify({ spent_minutes: 480, completion_pct: 90 }),
},
);
const { data } = await res.json();
console.log(data.spent_minutes); // 480import requests
res = requests.patch(
"https://utter.ae/api/v1/workspaces/utter/projects/WEB/issues/WEB-12/time",
headers={"Authorization": "Bearer utp_live_a1b2..."},
json={"spent_minutes": 480, "completion_pct": 90},
)
print(res.json()["data"]["spent_minutes"]) # 480The same ownership rule applies over the API: the key's user must be the issue's reporter, its assignee, or hold the edit-any permission, or the PATCH is refused. If you script anything against these fields, remember the conversion: the API speaks minutes (90, not 1.5), and completion_pct is the plain 0 to 100 number.
What Utter's time tracking does not do
Being straight about the limits saves you building a habit the tool does not support.
There is no timer. No stopwatch, no start-stop button, nothing that captures time automatically while you work. Spent is a single number you type, and it is cumulative: it represents total time spent so far, not a log of individual sessions. If you want to add an hour, you read the current value and type the new total. There is no worklog history, no list of "2h on Monday, 3h on Wednesday" entries. One number, overwritten each time you update it. If per-session records matter to you, keep them somewhere else and enter the running total here.
A few smaller edges, gathered in one place so none of them surprise you:
- You enter hours in the UI, but minutes are stored. Do not go looking for a minutes input; there isn't one.
- The budget percentage caps at 100 in the display, then reads "Over." You will never see a number above 100%.
- The budget bar only exists when there is an estimate. Spent alone gives you a number but no bar.
- Completion snaps to steps of 5. You cannot set 37%; it will be 35 or 40.
- The Summary Time card rounds to whole hours and only appears once the project has time on it, so small totals can read 0h or hide the card.
- The Estimate / Spent list column is off until you turn it on in the column picker.
- The Gantt fill is completion, not budget. Progress, not time burned.
None of these are dealbreakers, and there are clean habits around them. Update spent at the end of each working session so the cumulative number stays honest without a timer. Estimate in the units the field wants (hours, decimals fine) and let the storage worry about minutes. Treat orange on the budget bar as your cue to re-estimate or cut scope, not as a number to explain later. And use completion as your own read on progress, kept deliberately separate from the clock, so "how done" and "how expensive" stay two answers instead of one muddled average.
That separation is really the whole philosophy. Estimate is the bet, spent is the reality, completion is the progress, and the value is in seeing all three at once rather than collapsing them into a single misleading figure. Once you are tracking time this way per issue, the sprint-level habits get easier too: running a sprint and prioritizing your backlog both lean on knowing which work is consistently costing more than it should.
Set an estimate on your next ticket the moment you pick it up, then log the real hours as you go. One sprint of honest numbers and the estimate-vs-spent pattern starts telling you where your team's guesses go wrong.
Frequently asked questions
Do I enter time in hours or minutes on an Utter issue?
Hours. Both the Estimate (h) and Spent (h) fields take hours, and decimals are allowed (2 or 1.5). Utter converts to minutes internally and stores estimate_minutes / spent_minutes, but you never type minutes in the interface. If you read the values back through the API, they come out in minutes.
Is there a start/stop timer, or does Utter track time automatically?
No. There is no timer, stopwatch, or automatic capture. Spent is a single number you type yourself, and it is cumulative (total so far, not a log of sessions). To keep it current, update it at the end of each working session.
Why isn't the budget bar showing on my issue?
The budget bar only renders once an estimate greater than zero is set. If you have filled in Spent but left Estimate empty, there is a spent number but no bar and no percentage, because there is no budget to measure against. Add an estimate and the bar appears.
Does the completion slider fill in automatically from spent vs estimate?
No. Completion is fully manual and independent of estimate and spent. Setting spent hours does not move the slider, and moving the slider does not touch your time figures. You can even set completion with no estimate at all, so "how done" and "how much time" stay separate facts.
What does "Over" mean on the budget bar instead of a percentage?
It means spent has passed the estimate, so you are over budget. The percentage display caps at 100, and past that point Utter shows the word "Over" in pink rather than a number above 100. A single clear word reads faster than something like "180%."
Who is allowed to edit the estimate and spent time on an issue?
Only the issue's reporter, its assignee, or a member with the issue.edit_any permission. Everyone else sees the Time card but with disabled fields and slider, so they can read the numbers but not change them.
How do I see total estimated vs spent hours across a whole project?
Open the Project Summary. Its Time card shows Estimated, Spent, and Remaining for the whole project (rounded to whole hours) with a project-wide budget bar, and Remaining turns pink when spent passes estimate. The card only appears once the project has some time on it, and the Workload section below breaks it down per assignee as {spent}h / {estimate}h estimated.
Can I read or set issue time through the API or an AI agent?
Yes. Time is exposed over the public API and through MCP as a sub-resource with snake_case fields: estimate_minutes, spent_minutes, and completion_pct. The two time fields are in minutes (matching storage, not the hours you type in the UI), and completion_pct is the 0 to 100 value.
Related reading
Story points or hours, and parallel sprints when squads share a project
Utter now estimates in story points or hours per project (Fibonacci scale, points-based velocity) and runs parallel sprints when squads share a project. Both opt-in, on every plan.
July 17, 2026 · 7 min read
How to read the project summary
Read the Utter project Summary tab like a pro: what every card shows, how each number is computed, what good looks like, and where the dashboard stops.
July 15, 2026 · 16 min read
How to use a kanban board: a complete guide with a real example
Learn how to use a kanban board in Utter: read cards, drag tasks between columns, add and reorder custom columns, set WIP limits, filter, and save views.
July 15, 2026 · 20 min read
Project calendar view
Open Utter's Calendar tab to see project due dates on a month or week grid, drag deadlines to reschedule, edit status inline, and filter by assignee.
July 15, 2026 · 13 min read
How to organize work with epics and subtasks
Learn Utter's epics, stories, tasks, subtasks hierarchy: group work under an epic, break issues into subtasks, read the progress bar, and the rules it enforces.
July 15, 2026 · 17 min read
Project reports and insights
Read Utter's project reports and dashboards: Summary KPIs, sprint burndown, cycle time, throughput, workload, and workspace Insights, with the honest limits on each.
July 15, 2026 · 16 min read
How to bulk edit issues
How to bulk-edit issues from Utter's List view: multi-select, bulk status/priority, unassign, archive, and human-in-the-loop AI triage, plus the real limits.
July 15, 2026 · 14 min read
Custom fields in issue tracking
Add custom fields in an issue tracker: create project-scoped fields, pick the right kind, make them required, and show them as List columns and filters in Utter.
July 15, 2026 · 18 min read
Gantt chart with dependencies
Learn to plan on Utter's Timeline: read the Gantt, drag bars to reschedule, draw Blocks/Relates/Duplicates dependencies, schedule undated issues, and the real limits.
July 15, 2026 · 14 min read
How to run a sprint
Learn how to run a sprint in Utter: plan from the backlog, start and complete a sprint, carry over incomplete issues, and read the burndown and velocity.
July 15, 2026 · 13 min read
Add a comment
Start the conversation.