
How to track api usage and audit logs
You handed an API key to an agent last week. Now something looks off in project WEB. A ticket you did not touch moved from Backlog to Done. No comment, no obvious reason. Before you accuse anyone, human or machine, you want to know what that key has actually been doing: how many calls it makes, whether it errors, whether someone changed a webhook while you were not watching. That is what the Developer console's Usage and Audit tabs are for. Getting api usage and audit log project management right is mostly about knowing which of those two tabs answers which question, and which one never will.
Here is the short version before the long one. Usage tells you how much traffic your workspace's API is taking and how much of it is failing. Audit tells you who created, revoked, or changed keys, webhooks, and OAuth clients, and when an anomaly fired. Neither one tells you "the agent moved WEB-12 to Done." That fact lives in a third place: the issue's own Activity feed. Keep those three surfaces straight and you stop hunting in the wrong tab at exactly the moment you are stressed.
One thing to hold onto from the start: both tabs are ClickHouse-backed and best-effort. That buys you uptime and costs you a sliver of completeness. I will come back to the bill later.
What the api usage and audit log project management view actually covers
Two questions, two homes.
Usage answers volume and health. How many requests came in this week? What fraction errored? Which endpoints are getting hammered, and how ugly is the slow tail? If you just wired up an integration, this is where you confirm it behaves: steady request count, near-zero errors, latency that does not spike.
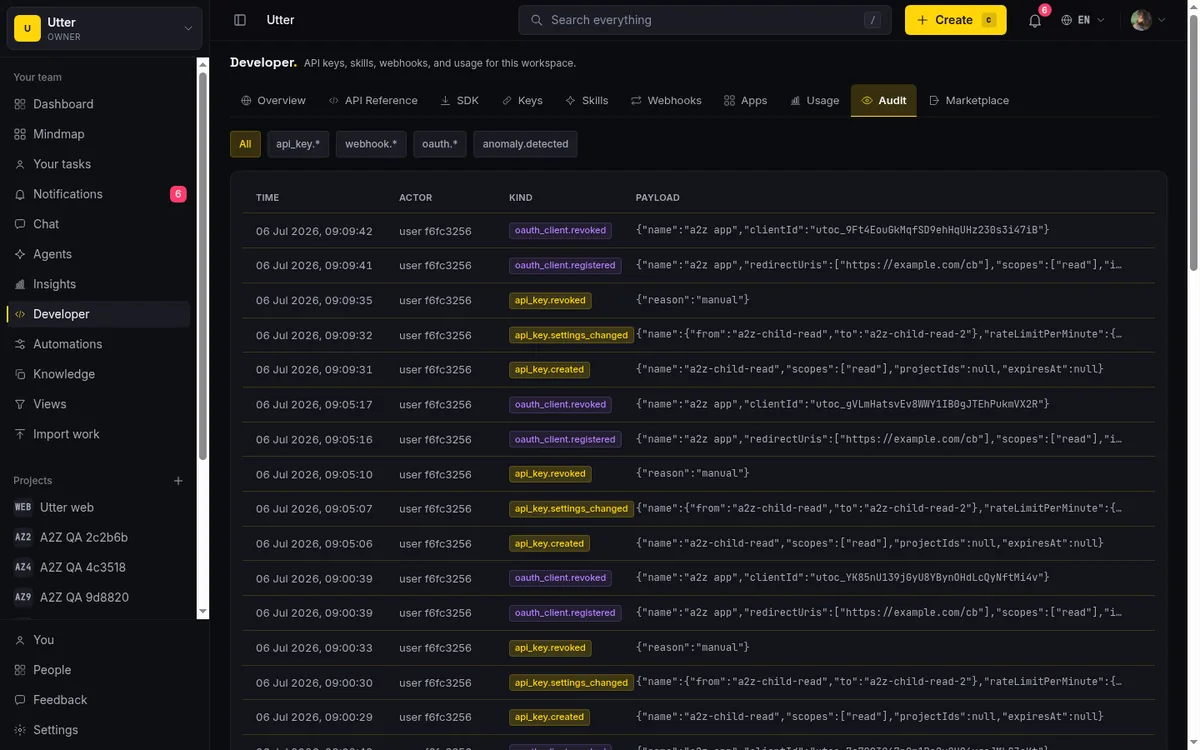
Audit answers lifecycle. Who minted this key? Who revoked that one? Who changed a key's rate limit at 2am? Did an OAuth client register that you do not recognize? Did the anomaly detector fire because a key suddenly started deleting things in bulk? Each of those is a discrete event with an actor, a kind, and a JSON payload.
The trap: people open Audit expecting to see "agent moved WEB-12 to Done" and it is not there. It was never going to be there. The Audit tab logs API-key, webhook, and OAuth lifecycle events, plus anomalies. It does not log issue field changes. Those live in the append-only Activity trail on each issue's detail page. So the real mental model is three surfaces, not two:
flowchart TD
    Q[What do you want to know?] --> T[How much traffic, how healthy]
    Q --> L[Who touched keys, webhooks, OAuth]
    Q --> W[What changed on an issue]
    T --> U[Usage tab]
    L --> A[Audit tab]
    W --> F[Issue Activity feed]
Usage for traffic and errors. Audit for credential and integration lifecycle. The issue Activity feed for the work an agent actually did.
Open the Developer console (and who is allowed in)
The console lives at /w/[workspace]/knowledge/developer. Swap in your workspace slug and you land on a panel that describes itself plainly: "API keys, skills, webhooks, and usage for this workspace." It sits under the workspace, not under a single project, so everything here is workspace-wide.
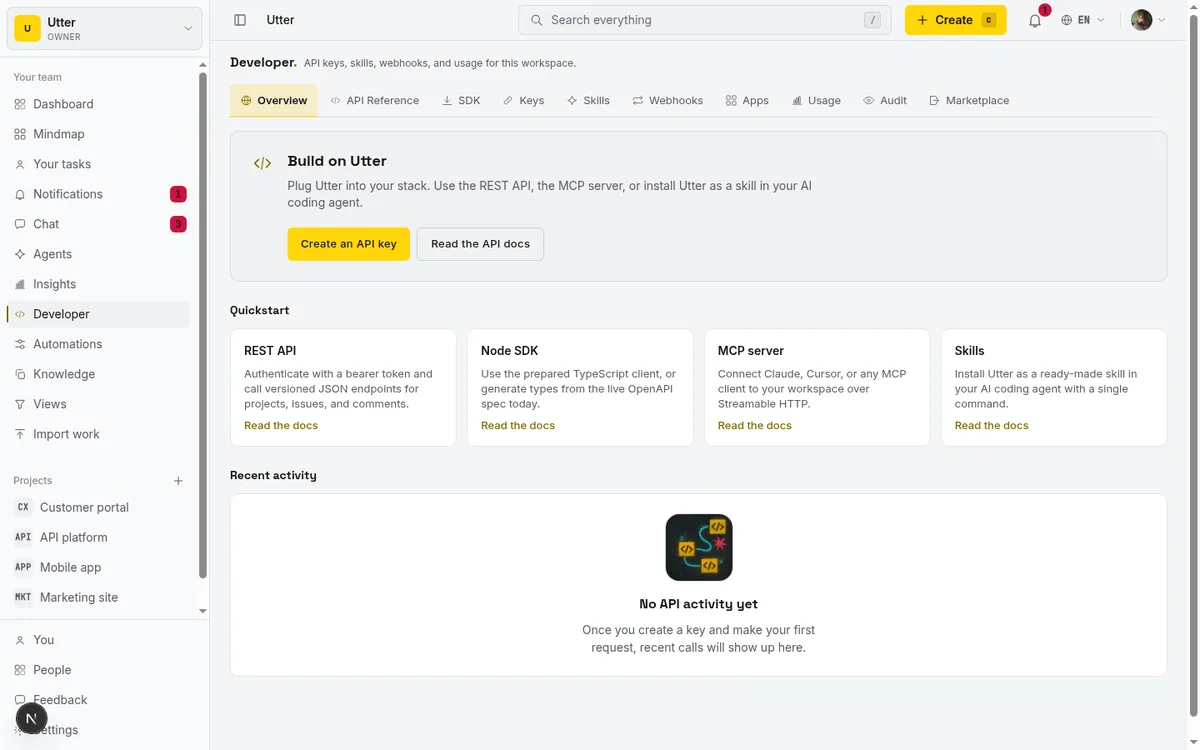
Now the part that catches people. The whole Developer panel is gated on the workspace.edit_settings permission. In practice that means only owner and admin roles get in. If you are a member or a viewer and you paste that URL, the server does not hand you a stripped-down view or an empty state. It redirects you to the workspace home.
There is no read-only usage view for regular teammates. So when a developer on your team says "I can't see the API usage," that is not a bug. That is the permission model. Bump their role, or pull the numbers for them yourself.
Once you are in, the tabs at the top switch you between Usage and Audit. The same strip holds Keys, which is where the rate-limit control lives, and where I am sending you later. The tab is in the URL, so ?tab=usage and ?tab=audit are bookmarkable and shareable with anyone who also has admin.
If you have not created a key or called an endpoint yet, how to use the REST API covers that ground first and pairs naturally with this.
Read the Usage tab: stat tiles and the date range
Start by choosing your window. Three buttons sit at the top: Last 7d, Last 30d, Last 90d. The active one wears the yellow signal style, so you always know which range you are looking at. Click a different range and it re-runs the rollup against ClickHouse, showing a small "Loading…" hint while the query is in flight. Match the window to the question. Debugging something from yesterday? 7d. Watching a slow trend? 90d.
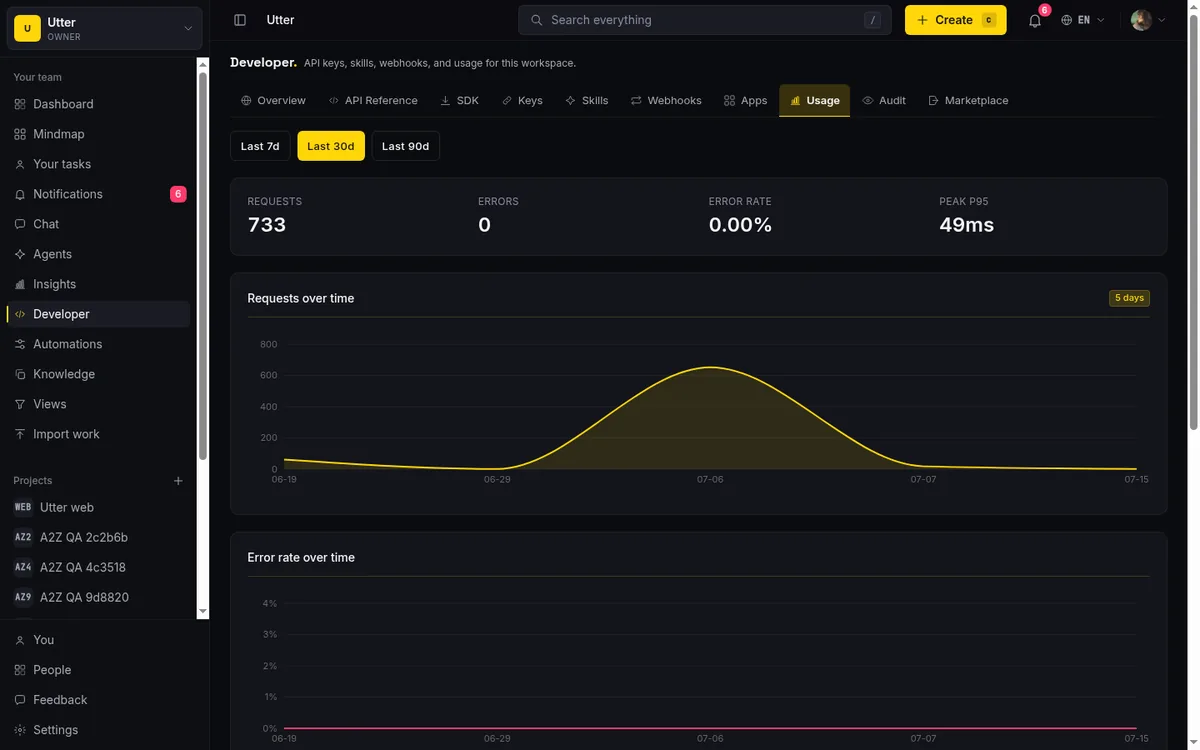
Under the range buttons are four stat tiles. Read them left to right.
- Requests is the total call count in the window.
- Errors is how many failed. This tile turns pink the moment it goes above zero, so a pink Errors tile is your cue that something is off.
- Error rate expresses that as a percentage to two decimal places. It is the number you actually want to track over time, because raw error counts scale with traffic and the rate does not.
- Peak p95 is a latency figure in milliseconds.
Peak p95 deserves a second read, because it is easy to misread. It is not a single p95 computed across the whole window. It is the maximum of each day's p95 latency across the days in the window. So if six days sat at 120ms and one bad day spiked to 900ms, Peak p95 reads 900ms. That is deliberate. It surfaces your worst day instead of letting a smooth average bury it. When it looks high, go find the day.
A concrete read. You are checking the agent you handed a key to on WEB. You pick Last 7d and see Requests 4,120, Errors 0, Error rate 0.00%, Peak p95 180ms. That is a well-behaved integration. Steady volume, nothing failing, latency tight. Now imagine Errors sitting pink at 47 and Peak p95 reading 2,400ms. Different day. You would move straight to the charts to find out which day and which endpoint.
Read the three usage charts
Below the tiles are three charts. Together they turn "something is wrong" into "here is what is wrong."
Requests over time is a filled yellow area chart. The x-axis shows MM-DD dates, the y-axis uses compact notation (k for thousands, M for millions), and hovering gives you a real tooltip with the exact count for that day. There is also a small yellow badge reading "{n} days" that tells you how many days actually returned data.
That badge is more useful than it looks. If you picked Last 30d but the badge says "6 days," your key has only been active for six days, and the flat stretch before that is not "traffic dropped." It is "nothing existed yet."
Error rate over time is the same shape in pink, with a percentage y-axis, computed per day as errors divided by requests. A flat line along the bottom is what healthy looks like. A bump on a specific day is your timestamp.
Top endpoints is a horizontal bar breakdown in cyan, up to ten endpoints ranked by request volume. Each bar shows the endpoint's request count in compact form, and when that endpoint had errors, it appends the error percentage with an "err" suffix, so you might read 1.2k · 3.4% err. Endpoints that could not be labeled show as "(unknown)". If the window is empty, it reads "No endpoint activity in this window."
Here is how you use the three together. A spike in the error-rate chart on, say, 07-12 gives you the day. You look at Top endpoints to see which bar carries an error percentage. When the spike lines up with one endpoint showing "err," that is your smoking gun. You now have the day and the endpoint, and you can go read that handler or the agent's code path against it.
One thing that trips people: 429 responses count as errors here. If your agent is hitting a rate limit, it shows up as elevated error rate, folded in with genuine failures rather than broken out on its own. So if the error rate climbs but the endpoints look fine and nothing is throwing, suspect rate limiting and go check the cap.
When the Usage tab is empty (and what it will not show)
The empty and error states are honest. Knowing them saves you from deciding the tab is broken.
- "No API usage yet" with the line "Once your API keys start making requests, usage charts will appear here" is the normal state for a fresh key nobody has called. Not an error. Nothing has happened.
- "Could not load usage data. Try again shortly." means the ClickHouse query itself failed. The analytics store hiccuped, not that you have no traffic. Wait a moment and reload.
Now the real limits, so you do not go looking for things that are not there. The Usage tab reads a pre-aggregated table, papi.api_usage_daily, so everything is per day. There is no hourly view, no per-request drill-down, no live real-time feed. If you need to know exactly which request failed at 14:32, this tab will not give it to you. Raw per-request rows exist in the backend, but they are not on this tab.
And the one that surprises people most: the Usage tab always shows the whole workspace. There is no per-key filter in the UI. So if two agents share a workspace, their traffic is summed here. Do not spend ten minutes hunting for a dropdown that does not exist.
To isolate one key, use the per-key usage endpoint instead. It needs a key with the api_keys:read scope, takes from and to as ISO dates (defaults: the last 30 days, capped at 90), and returns a per-day series:
curl -s "https://utter.ae/api/v1/workspaces/acme/api-keys/KEY_ID/usage?from=2026-07-01&to=2026-07-15" \
  -H "Authorization: Bearer utp_live_YOUR_KEY"
const res = await fetch(
"https://utter.ae/api/v1/workspaces/acme/api-keys/KEY_ID/usage?from=2026-07-01&to=2026-07-15",
{ headers: { Authorization: "Bearer utp_live_YOUR_KEY" } },
);
const { data } = await res.json();
console.log(data.totals);import requests
res = requests.get(
"https://utter.ae/api/v1/workspaces/acme/api-keys/KEY_ID/usage",
params={"from": "2026-07-01", "to": "2026-07-15"},
headers={"Authorization": "Bearer utp_live_YOUR_KEY"},
)
print(res.json()["data"]["totals"])The response is one point per day plus totals, with p50/p95/p99 latency per day:
{
  "data": {
    "key_id": "0197f3a1-2b4c-7d5e-8f90-1a2b3c4d5e6f",
    "from": "2026-07-01",
    "to": "2026-07-15",
    "granularity": "day",
    "series": [
      { "date": "2026-07-01", "requests": 512, "errors": 0, "p50_ms": 45, "p95_ms": 140, "p99_ms": 320 }
    ],
    "totals": { "requests": 4120, "errors": 0, "p95_ms": 180 }
  }
}
That, or give each agent its own workspace, is how you separate one agent's traffic from another's.
Investigate lifecycle events on the Audit tab
Switch to Audit and the shape changes completely. Now you are reading a reverse-chronological table, newest first, four columns: Time, Actor, Kind, Payload.
Across the top are filter chips: All, api_key., webhook., oauth., anomaly.detected. Click one and it re-queries; the active chip highlights yellow. These are your main tool for cutting noise. Investigating something about keys? Click api_key. and the rest drops away.
Reading the columns takes a second to learn. Actor is compact. It shows "user" plus the first eight characters of the id when a human did it, "key" plus the first eight characters when another API key did it, or a plain dash when neither applies (some system-originated events have no actor). Kind is a color-toned badge so you can scan by type: pink for anomaly, cyan for webhook, purple for oauth, yellow for api_key. Payload shows roughly the first 80 characters of the raw JSON. Enough for the gist, not the whole story.
At the bottom, Load more pages through older events with cursor pagination, fifty rows per page, keyed on the last row's timestamp. It reads "Loading…" while fetching. There is no date picker and no free-text search here, so Load more plus the filter chips is the whole navigation kit. If there are no events, you see "No audit events yet" with "API key, webhook, and OAuth lifecycle events will appear here as they happen." On a backend failure, "Could not load audit events."
A worked example. Back to that unexpected move on WEB. You suspect a key got revoked or changed around then. Click api_key.*. The table narrows to key lifecycle only. Scan the Time column to the right day, read Actor to see whether a user or another key did it, and check the Kind badge for whether it was a revoke, a settings change, or a rate-limit change. Under a minute, and you know who touched what.
The same recent rows also show up as a short list on the Developer Overview tab, a quick "recent developer activity" glance. It is the first few rows of the same query, handy when you want a pulse without opening the full table.
Open a row for the full event detail
The 80-character preview is a teaser. Click any row and a modal opens, titled with the event kind, showing everything.
Inside the "Audit event" modal you get Time, the Kind badge again, Actor rendered as the full id (user: or key: prefixed), Target (the full target id, or a dash if the event had none), and the whole Payload as pretty-printed, indented JSON. This is where you read the real context instead of guessing from a truncated line.
This modal is the only place some information lives. Take an anomaly. On the table it just reads "anomaly.detected" with a pink badge, because every anomaly is stored under that single kind. The specific type, whether it was a delete_surge, a multi_ip_key_use, or an unauthorized_ip_spike, is inside the payload, not the kind. The only way to tell one anomaly from another is to open the row and read the JSON. Same for a webhook change or an OAuth grant: the kind gives you the category, the payload gives you the specifics.
One honest caveat. The ids in here are raw UUIDs. The table shows the first eight characters, the modal shows the full id prefixed with user: or key:, but neither resolves to a name or an email. So you read user:9f3a1c2d... and have to cross-reference it yourself against your members or keys list to put a face to it. Precise, just not friendly.
What the Audit tab does not log
Read this section slowly, because getting it wrong sends you looking in the wrong place at the worst moment.
Here is the exact set of kinds the Audit tab emits, and it is the complete set:
api_key.created,api_key.revoked,api_key.rate_limit_changed,api_key.settings_changedoauth_client.registered,oauth_client.revoked,oauth_grant.issued,oauth_token.minted,oauth_token.revokedanomaly.detected
The webhook.* filter chip is reserved for future webhook lifecycle events; it currently returns nothing, because those events are not emitted yet. That is the whole list. Credentials and integrations. Notice what is missing: issue edits, comments, status changes, board moves, member invites, role changes. None of those are logged here. Despite the name, the Audit tab is not a general "audit log of every write action."
So where do those things live? Two other places.
Per-issue product changes (an assignee change, a status move, a description edit, whether a human did it in the UI or an agent did it through the API) are recorded in that issue's append-only Activity feed on its detail page. That is the surface that will actually tell you "agent moved WEB-12 to Done." If you are auditing what an agent did to your work, that is the feed you want. There is a whole piece on building that habit in keep an audit trail of AI agent changes.
Workspace-level and member-level changes (member added, role changed, SSO configured, SCIM sync) go to a separate MariaDB audit_log table that is not surfaced anywhere in this Developer Audit tab. Different store, different surface, not shown here. Do not conflate the three. The Developer Audit tab is narrow on purpose: it is the credential and integration ledger, nothing more.
And the "best-effort" bill I promised. Audit writes are fire-and-forget. If ClickHouse is down or slow the moment a key gets revoked, the revoke still succeeds, but the audit line can be silently dropped. The mutation happened; the record of it might not. Treat the audit trail as very good, not a legal guarantee of completeness. For anything you need to prove, do not lean on a single dropped-if-unlucky line.
Set a per-key rate limit (and what enforcement looks like)
This control is not on Usage or Audit. It lives on the Keys tab, and it is worth the walk, because rate limiting is often the answer to "why is my error rate climbing."
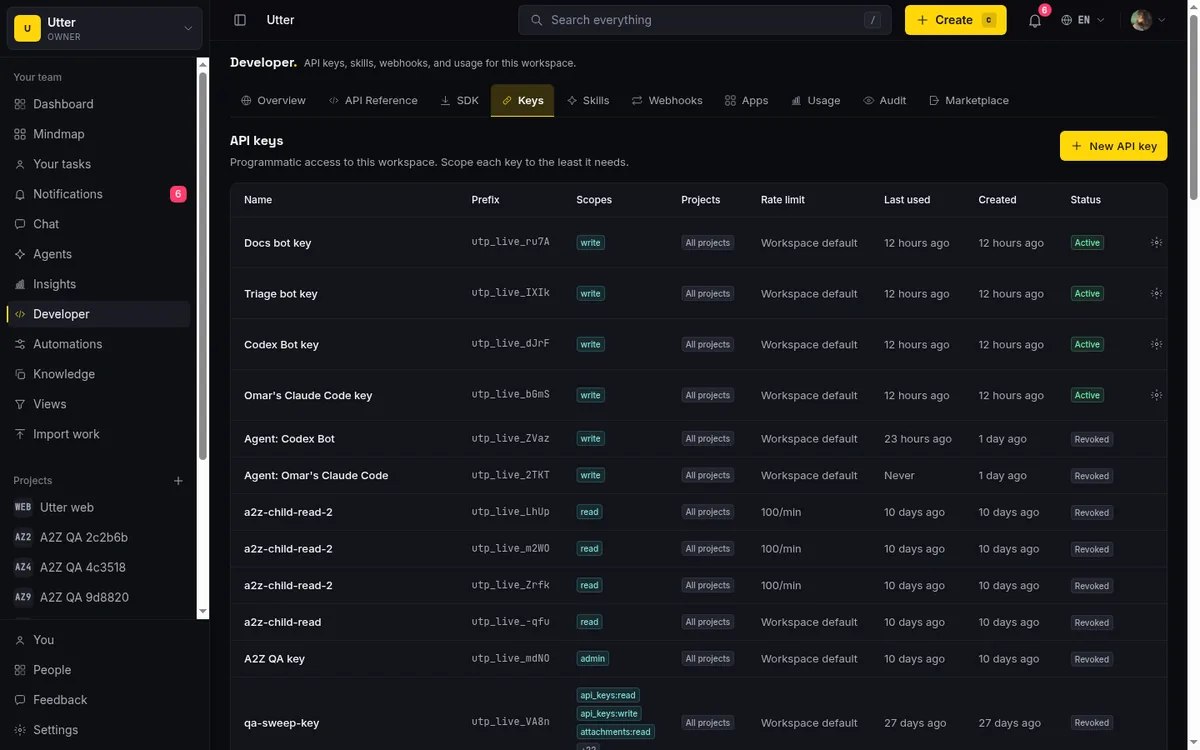
On the Keys tab, each key shows its cap in a Rate limit column, reading either "N/min" or "Workspace default." To change it, use "Edit rate limit," which opens a field labeled "Requests per minute." Leave it blank and the key falls back to "Workspace default." Set a number and that becomes the key's own ceiling.
Enforcement is real and server-side. Utter runs a per-key sliding-window limiter, and when a key has no explicit cap the default is 600 requests per minute. Every /api/v1 response carries the standard headers, X-RateLimit-Limit, X-RateLimit-Remaining, and X-RateLimit-Reset (a unix timestamp), so a well-written client can watch its own budget and back off before it gets rejected. When a key blows past the limit, the rejection looks like this:
HTTP/1.1 429 Too Many Requests
X-RateLimit-Limit: 600
X-RateLimit-Remaining: 0
X-RateLimit-Reset: 1752662400
Retry-After: 18

{
  "error": {
    "code": "rate_limited",
    "message": "Rate limit exceeded. Slow down and retry shortly.",
    "details": { "retry_after_ms": 17400 }
  }
}
A polite client reads Retry-After, waits, and tries again:
sequenceDiagram
    participant Agent
    participant API as Utter API
    Agent->>API: request with Bearer key
    API-->>Agent: 200 plus rate limit headers
    Note over Agent,API: Remaining hits 0 within the minute
    Agent->>API: next request
    API-->>Agent: 429 rate_limited plus Retry After
    Agent->>Agent: wait the Retry After seconds
    Agent->>API: retry
    API-->>Agent: 200
Two things tie this back to the other tabs. Changing a key's cap emits an api_key.rate_limit_changed audit event, so the change shows up on the Audit tab (filter to api_key.* and you will find it). And, as I mentioned, 429 rejections count as errors on the Usage tab. They are not charted as a separate throttled series. So a rate-limited agent reads as elevated error rate. If your Usage error rate is up but your handlers are healthy, raise the cap a little or fix the agent's request pacing, then watch the rate settle.
If you are shaping per-agent behavior more broadly, how to set agent field permissions covers restricting what a key can write, which pairs well with capping how fast it writes.
A practical routine for watching an agent's API activity
Turn it into a habit and the three surfaces stop feeling like scattered screens.
Weekly, open Usage on Last 7d. Glance at the four tiles. Is the error rate creeping up week over week? Has the endpoint mix shifted, some new endpoint suddenly topping the bar chart that this agent had no business calling? Five minutes, and you catch drift before it becomes an incident.
After any change to a key or a webhook, or the moment an anomaly fires, open Audit. Filter to the relevant chip. Confirm the change was you, or someone you expected, and not a surprise. If it is an anomaly, open the row and read the payload to learn whether it was a delete_surge or a multi-ip issue, because the kind alone will not say.
And when you need the actual work record, the thing that started this whole exercise, go to the issue. Open WEB-12, scroll to its Activity feed, and read the real line: the agent moved it from In Review to Done at a specific time. Usage never had that. Audit never had that. Only the issue's own feed does.
That is the whole model. Usage for how much and how healthy. Audit for who touched the credentials and integrations. Issue Activity for what changed in your work. Three questions, three homes. Once you know which is which, you stop wasting time in the wrong one.
Open the Developer console now and check the one key you care about most.
If you are wiring an agent into Utter for the first time, how to install Utter as an agent skill is the companion to this monitoring workflow.
Frequently asked questions
Who can see the API usage and audit log in Utter?
Only owner and admin roles. The whole Developer console at /w/[workspace]/knowledge/developer is gated on the workspace.edit_settings permission. Members and viewers who open the URL are server-redirected to the workspace home, so there is no read-only usage view for regular teammates. If a developer needs access, raise their role or pull the numbers for them.
How do I monitor how many requests an API key is making?
Open the Usage tab and pick a window (Last 7d, 30d, or 90d). The Requests tile gives the total call count, and the Requests over time chart shows the per-day trend. One caveat: the Usage tab always shows the whole workspace, with no per-key filter in the UI, so if two keys share a workspace their traffic is summed. To isolate one key you need the separate per-key usage endpoint, which lives outside these tabs.
Does the audit log show issue edits, comments, and status changes made through the API?
No. The Audit tab logs only API-key, webhook, and OAuth lifecycle events plus anomalies. Issue field changes such as status moves, assignee changes, and comments, whether made in the UI or through the API, are recorded in that issue's append-only Activity feed on its detail page, not in the Developer Audit tab. Look there for who changed what on a ticket.
How do I find out who revoked an API key or changed its rate limit?
On the Audit tab, filter to the api_key.* chip; key revocations, rate-limit changes, and settings changes all live there. Find the row by its Time, read the Actor column to see whether a user or another key did it, and click the row to open the full detail modal with the complete actor id and JSON payload. Actor ids are raw UUIDs and are not resolved to names, so cross-reference them against your members or keys list.
Can I filter the usage charts by a single API key?
Not in the UI. The Usage tab always shows the whole workspace. The underlying rollup can be scoped to one key, and a separate per-key usage endpoint exists, but neither is surfaced as a filter control on this tab. Do not go looking for a dropdown that is not there.
What is 'Peak p95' on the Usage tab measuring?
It is the maximum of the daily p95 latencies across your selected window, not a single p95 computed over the whole window. In other words it surfaces your worst day's tail latency. If six days sat at 120ms and one day spiked to 900ms, Peak p95 reads 900ms, so a smooth average cannot hide a bad day.
How do I set a rate limit on a specific API key, and what happens when it is exceeded?
Go to the Keys tab (not Usage or Audit), use 'Edit rate limit,' and set 'Requests per minute'; blank means Workspace default, which is 600/min. Enforcement is server-side via a per-key sliding-window limiter, and every /api/v1 response carries X-RateLimit-Limit, X-RateLimit-Remaining, and X-RateLimit-Reset headers. A rejected request returns a 429 with a rate_limited envelope and a Retry-After header, and changing the cap emits an api_key.rate_limit_changed audit event, so it appears on the Audit tab.
Where do anomaly types like delete_surge or multi_ip_key_use show up?
All anomalies are stored under the single kind anomaly.detected, so the table row and the anomaly.detected filter chip do not distinguish them. The specific type (delete_surge, multi_ip_key_use, unauthorized_ip_spike) lives inside the payload JSON. Click the row to open the detail modal and read the pretty-printed payload to see which one fired.
Related reading
How to use the rest api
Get an Utter API key and use the project management REST API to list, create, and update issues safely, with scopes, idempotency keys, and rate limits explained.
July 15, 2026 · 16 min read
How to use webhooks
Set up outbound webhooks in Utter: create one, verify the HMAC signature (sha256-of-secret gotcha), handle at-most-once delivery, and pipe board events to Slack.
July 15, 2026 · 16 min read
Project reports and insights
Read Utter's project reports and dashboards: Summary KPIs, sprint burndown, cycle time, throughput, workload, and workspace Insights, with the honest limits on each.
July 15, 2026 · 16 min read
How to manage billing and plans
Read the Utter billing page at a glance: how editor seats are counted, why viewers and agents are free, where to upgrade, downgrade, cancel, and buy credits.
July 15, 2026 · 16 min read
How to read the project summary
Read the Utter project Summary tab like a pro: what every card shows, how each number is computed, what good looks like, and where the dashboard stops.
July 15, 2026 · 16 min read

The MCP audit: which project tools can AI agents actually use? (July 2026)
We audited the MCP servers of 13 project management tools: who has one, what agents can really do, the call caps, and the gaps nobody mentions.
July 15, 2026 · 7 min read

Keep an audit trail of everything your AI agents change
Once agents can write to your tracker, a shared bot account makes every change anonymous. Here is how per-agent identity keeps the trail readable.
July 15, 2026 · 8 min read
How to use the ai assistant
How to run your board with Utter's AI assistant: ask grounded questions, create and triage issues from a sentence, and approve every change before it lands.
July 15, 2026 · 14 min read
Let AI agents run your board over the REST API: authentication, scopes, and safe writes
A developer guide to giving an AI agent a scoped Utter API key so it can move cards and file issues without a big blast radius.
June 26, 2026 · 7 min read

How to manage roles and permissions
Learn how project management roles and permissions work in Utter: the five roles, inviting with the right access, scoped projects, and who pays for a seat.
July 15, 2026 · 18 min read
أضف تعليقًا
ابدأ النقاش.