
How to map your agent team
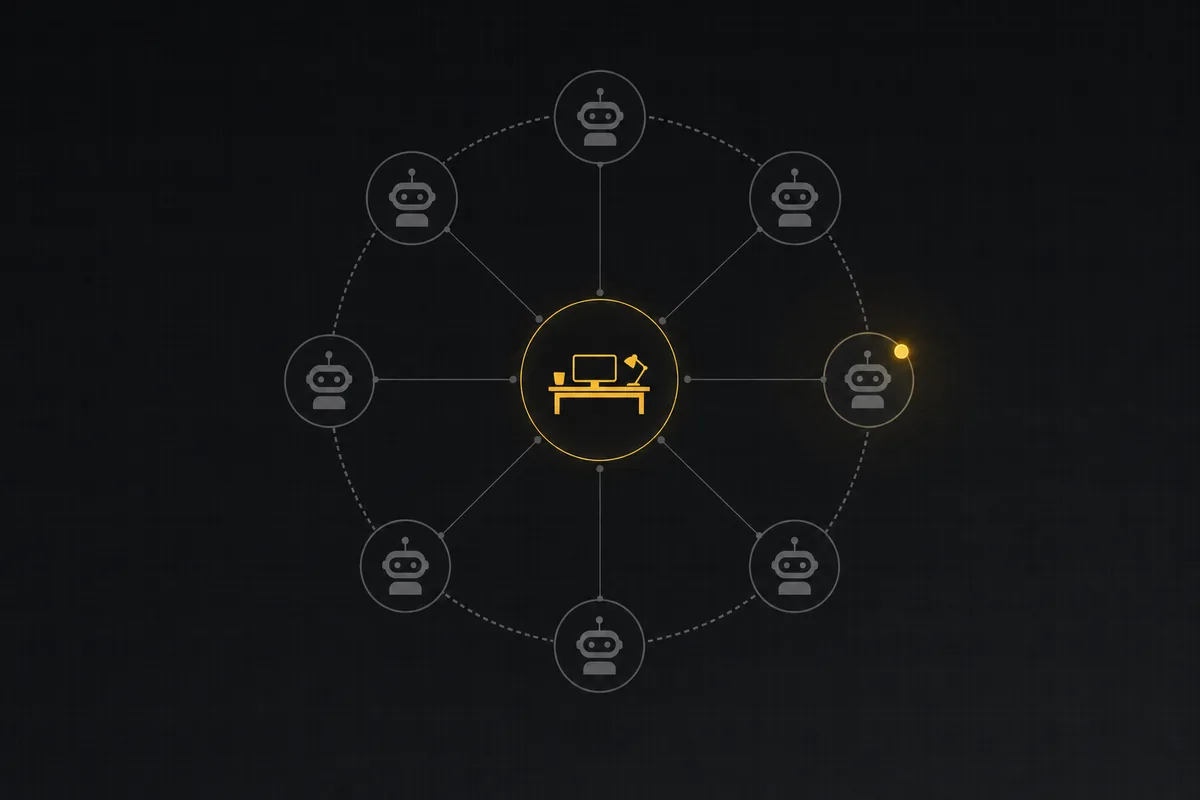
You connected five agents. Then eight. Now someone asks whether the WEB refactor agent is actually running or stuck waiting on input, and you don't know. You open the Agents hub, you get a list of names and owners, and you still have to click into each one to find out what it's doing. A list is a roster. It tells you who is on the team. It says nothing about what the team is doing right now.
That gap is what the Agent Map closes. If you want to visualize AI agents on a team the way you read a board at a glance, the map is the surface: one radial tree centered on your workspace, with every agent, who owns it, the projects it touches, and its live work, all readable without clicking into a single detail page.
This guide covers the whole thing. How to open it, how to read a status dot in one glance, how to regroup the same agents three ways to answer three different questions, how to catch a stalled agent before it burns your afternoon, and where the honest limits sit so you never expect something the map doesn't do.
Why you need to visualize AI agents on a team
The problem with a list is that it's flat. Six agents named Refactor Bot, Docs Writer, Triage, each with an owner column, sorted however the table sorts. That's fine for "who is connected." It's useless for "what is the shape of the work right now."
When you run a team of agents, your real questions are relational:
- Who owns the one that failed?
- Which agents are all piled into WEB at once?
- Is anything actually running, or is it all just assigned and waiting?
A table makes you reconstruct those answers one row at a time, in your head. That reconstruction is a tax, and it grows with every agent you add.
The map answers those questions by showing structure instead of a roster. It centers on your workspace, draws every agent around it, and under each agent the projects it works in and the specific tasks it's on. To visualize AI agents on a team you need the connections, not the names, and a radial tree is built for that: relationships radiating out from one center you can hold in your head.
Two things to know up front. The map is scoped to a single workspace. It is not org-wide or cross-workspace. And it's visible to every workspace member, the same access as the Agents hub itself, so there's no per-role gating beyond being in the workspace. What you see is one workspace's agent team, its owners, its projects, its live work.
How to open the Agent Map from the hub
Go to the Agents hub at /w/<workspace>/agents. That's the List view and where you land by default: the roster of every connected agent with its owner and status.
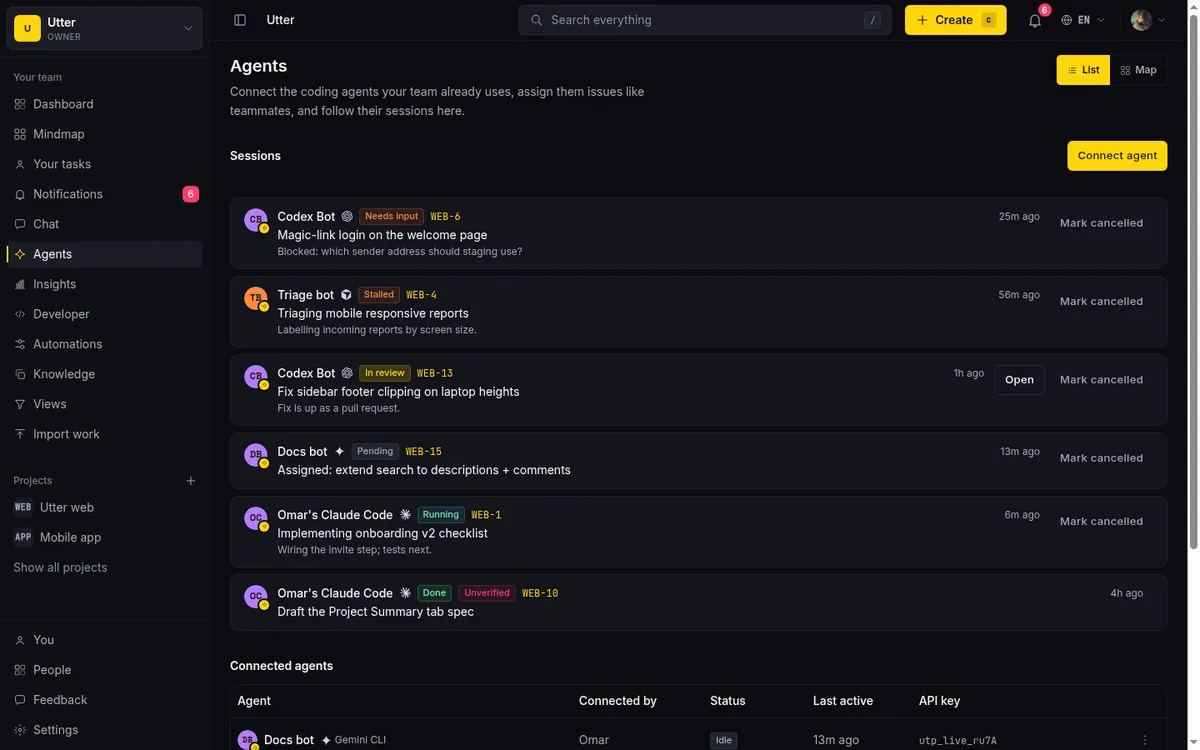
In the page header there's a segmented toggle with two links, List and Map. It's a plain server-rendered control, and the active tab is filled with brand gold so you can tell at a glance which view you're in. Click Map. You land on /w/<workspace>/agents/map, which is the whole tree.
Hold onto the split between the two views. List answers "who is connected." Map answers "what is the team doing." Same agents, two lenses. When you're onboarding a new agent or checking a key, List is the place. When you want to know whether the team is moving, Map is the one.
If your workspace is brand new with no agents connected, the map isn't a blank void. It shows a "No agents yet" empty state with a short line of guidance: connect an agent from the hub and it shows up here with its live work. A first-timer who opens the map before connecting anything gets pointed back to the right place instead of staring at nothing.
Reading the map at a glance
Slow down on this part, because once you can read the map in one glance, everything else is just navigation.
At the center sits the workspace root. Around it, one node per agent. The root node carries a live count: a pulsing cyan dot plus a compact number, and that number is how many agents are currently running. So before you read a single agent node, the root gives you the pulse of the whole workspace. Three running out of eight? You see it instantly.
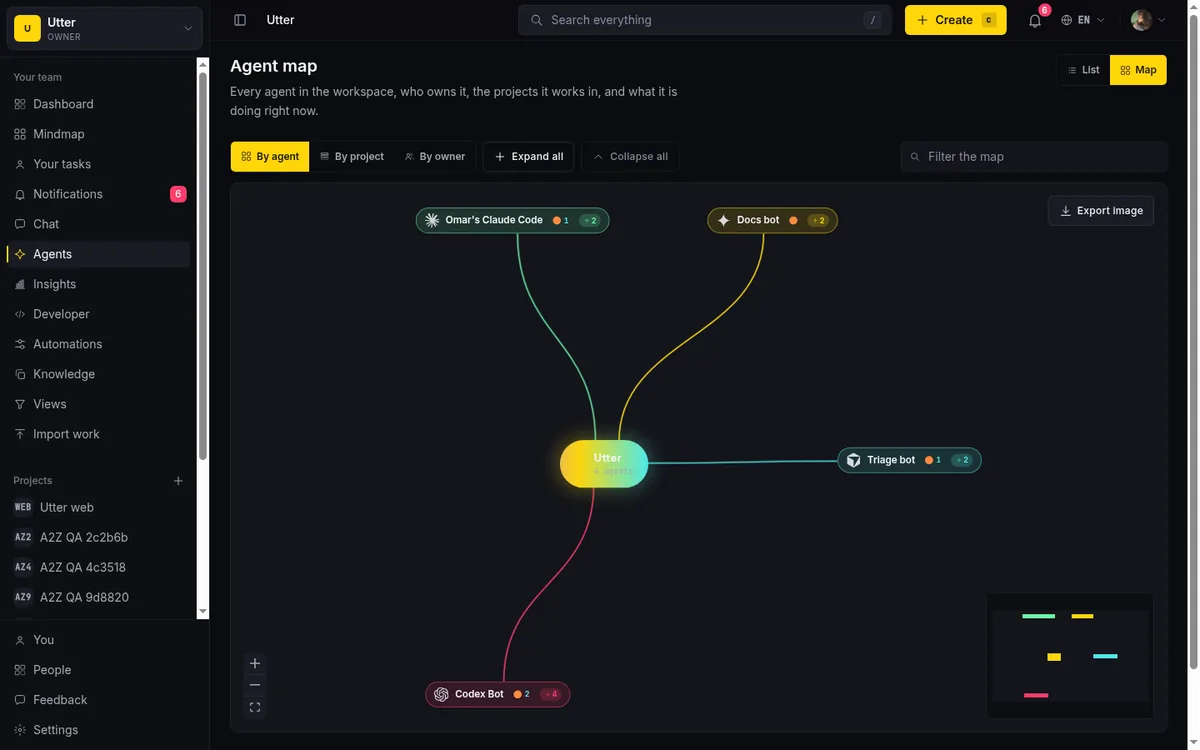
Each agent node carries a colored status dot, and this is the single most important thing to learn. The dot is an aggregate of everything that agent is doing, and its color follows a fixed vocabulary:
- Running is cyan, and it pulses. At least one live session is moving.
- Attention is orange. The agent needs input or has stalled. This is the color you want to catch fast.
- Review is yellow. Work is sitting in review, waiting on a human.
- Failed is pink. Something broke.
- Idle is grey. Nothing active.
Beside an agent's node you'll also see a cyan number when it has live sessions running, the per-agent version of the root's count. One agent running three sessions shows a cyan 3.
Here's the part people miss. Because the dot is an aggregate, there's a precedence order when an agent is doing several things at once: attention beats running, which beats review, which beats failed, which beats idle.
Read that with a concrete case. Say an agent has one session blocked and waiting on input, and a second session happily running. The dot reads orange, not cyan. The blocked state wins, on purpose, because the thing you need to know about that agent is that it needs you, even though it's also busy elsewhere. The dot tells you "this agent needs attention," not "this one session is running." Don't read it as a single session's status. It's the agent's whole situation compressed to one color.
How to regroup by agent, by project, or by owner
Same agents, same tasks, reshaped to answer whichever question you're actually holding. That's the second segmented control, up with the mode options: By agent, By project, By owner.
Each mode is a different nesting of the same tree:
- By agent (the default) nests Workspace to Agent to Project to Task. This answers "what is each agent doing?" You start from an agent and drill into its work.
- By project nests Workspace to Project to Agent to Task, and only projects with actual agent activity show up. This answers "what is happening in WEB?" You start from a project and see every agent piling into it, plus their tasks. If three agents are all in your WEB project, By project puts them side by side under one branch so the crowd is obvious.
- By owner nests Workspace to Owner to Agent to Project to Task. This answers "which of my reports owns the stuck agent?" You start from a person and see the agents they're responsible for. Owner nodes show the owner's avatar.
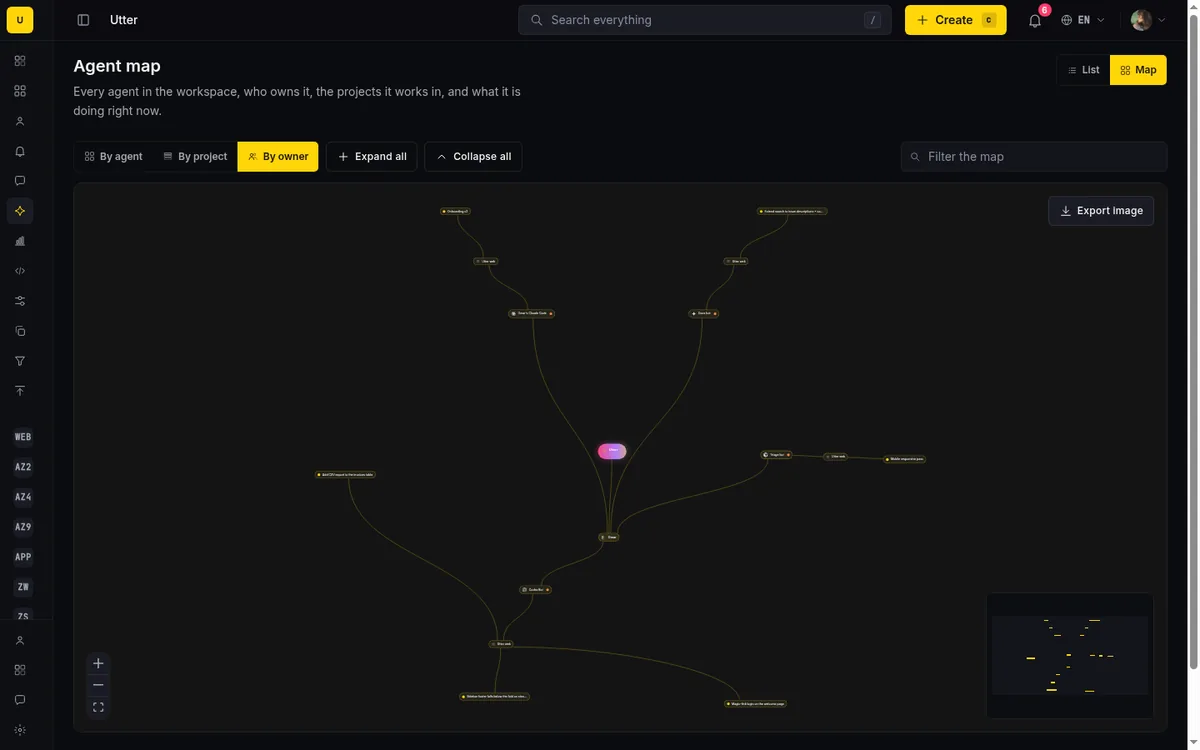
Match the mode to the question in your head:
| The question you're holding | The mode that answers it |
|---|---|
| "What's my triage agent up to?" | By agent |
| "Why is WEB moving so slowly?" | By project |
| "Who owns this broken one?" | By owner |
Same data, three answers.
One behavior to expect: switching modes resets the expansion state and refits the view. If you had a branch expanded in By agent and you flip to By project, the tree collapses back to a clean fitted layout. That's deliberate, since the whole shape changes, but it means you re-expand after a mode switch rather than expecting open branches to carry over.
Reading what each agent is working on right now
Click an agent branch to expand it. It opens to its projects, and under those, its work items. A work item is one of two things, and the difference matters: either a live session, or an open issue assigned to the agent that has no session yet.
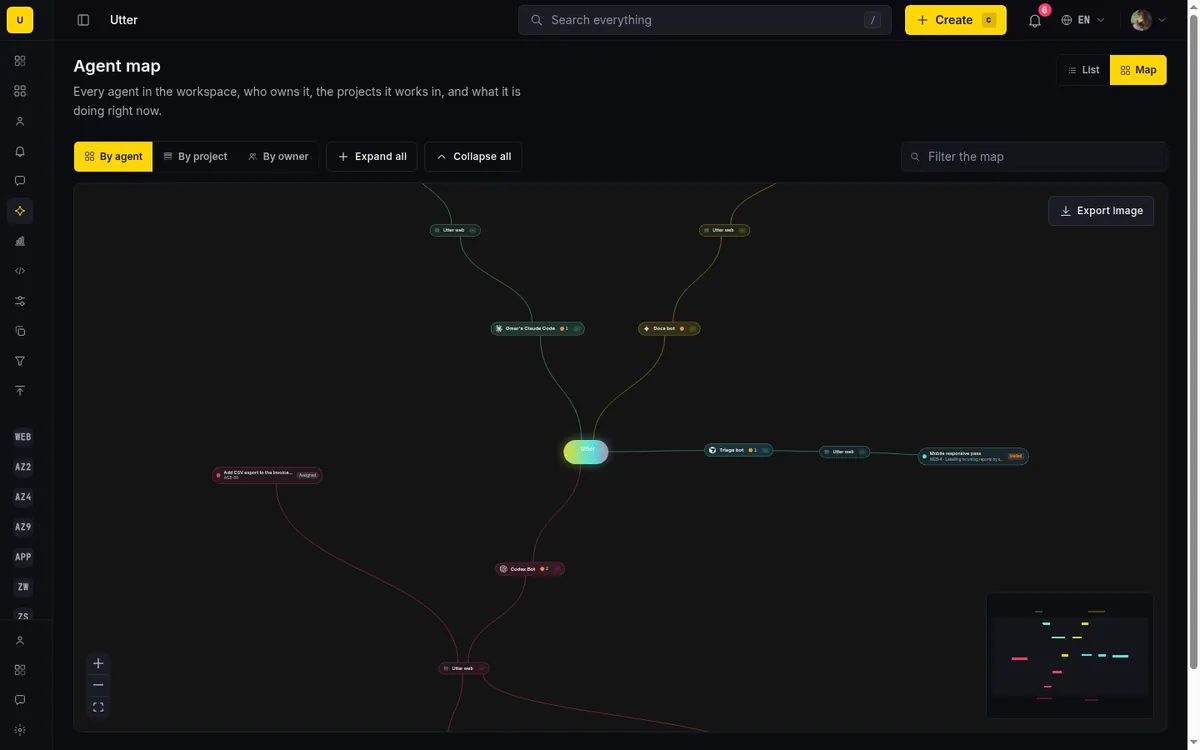
A session node shows you the real detail. The issue title, an issue-key sublabel underneath (something like WEB-42 on a "Timeline + Summary tab" ticket), the agent's live note (whatever it last reported it's doing), and a colored session-state pill. That pill is the session's own state, distinct from the agent's aggregate dot, and it reads as one of: Pending, Running, Needs input, In review, Done, Failed, or Cancelled.
The lifecycle behind those pills is short. A session is either created by the system when you assign an issue to an agent (that's Pending, waiting to be claimed) or started by the agent itself. From there the agent moves it between the working states until it lands in a terminal one:
stateDiagram-v2
    [*] --> pending: issue assigned to the agent
    [*] --> running: agent starts a session itself
    pending --> running: agent claims the work
    pending --> cancelled: unclaimed for 7 days
    running --> needs_input: blocked on a human
    needs_input --> running: input arrives
    running --> review: work ready for review
    review --> done
    running --> done
    running --> failed
    running --> cancelled
Then there's the other kind of work item: an assignment with no session behind it yet. An open issue is assigned to the agent, but the agent hasn't started a run on it. That renders dimmer, at 40% opacity, with an "Assigned" pill. Small design decision, big payoff. It means "what task is this agent on?" is answered even before the agent starts working, because the assignment itself is on the map. You're not blind to queued work.
Be clear about what "Assigned" means, though. It is not a live run. It's a queued issue. The dimming is the signal: bright means something is happening, dim means something is waiting. Don't read an Assigned item as an agent that's working.
Two more things about which sessions appear. Done and cancelled sessions are hidden, because the map is a view of active work, not a history log. But failed sessions stay visible, on purpose. A broken agent should be impossible to miss, so failure doesn't disappear the way completion does. If you want a full session history, the map is not that surface.
How to catch a stalled agent before it costs you
This is the feature that earns the map its keep. An agent that's silently stuck is worse than one that fails loudly, because failure at least shows up pink. A stall just sits there looking busy.
So the map watches for it. A session that's running or pending but has had no activity for over 30 minutes gets an orange "Stalled" pill, and the agent's status dot flips to attention orange (the attention state in the precedence order). You catch it as a color change on the tree. No digging.
The clever part is that this doesn't need a server event. A client-side clock re-derives stall state every 30 seconds, so an agent can go stale on your screen even though nothing came in from the server. It just crosses the 30-minute line and the pill appears on your next tick.
Be precise about what Stalled is, because the honesty matters. Stalled is a time-based heuristic, computed on the client from the last activity timestamp. It is not a stored session state. The seven states a session can actually be in are pending, running, needs_input, review, done, failed, and cancelled. There is no "stalled" state in the database. It's a derived hint, "this looks stuck," produced by a clock, not pushed by the agent.
Which means Stalled tells you an agent has gone quiet, not that it has definitively broken. Sometimes a long-running job is genuinely working and just quiet. But quiet-for-30-minutes is exactly the signal you want surfaced, and the map surfaces it before anyone pings you asking why WEB-42 hasn't moved.
Following live updates without reloading
The map is live. You don't refresh it. It opens a Server-Sent-Events stream to /api/w/<slug>/agents/stream, and when something happens to a session (created, claimed, heartbeated, or reaching a terminal state) the map patches just that node in place. No full tree rebuild, no flash, no scroll jump. The one node that changed updates and the rest holds still.
Each frame on the stream is a small JSON event. A session update looks like this:
{
  "type": "session.updated",
  "sessionId": "0197c9f2-8a41-7c3e-b1d2-4f5a6b7c8d9e",
  "agentUserId": "0197c8aa-1b2c-7d4e-9f01-23456789abcd",
  "state": "needs_input",
  "title": "Magic-link login on the welcome page",
  "note": "Blocked: which sender address should staging use?",
  "externalUrl": null,
  "issueKey": "WEB-6",
  "issueTitle": "Magic-link login on the welcome page",
  "projectSlug": "web",
  "lastActivityAt": "2026-07-15T09:41:12.000Z",
  "endedAt": null,
  "at": "2026-07-15T09:41:12.000Z"
}
Agent connect and disconnect events work a little differently. When an agent joins or leaves the workspace, the map pulls a fresh server snapshot rather than patching, because the set of nodes itself changed. Session updates patch; membership changes re-snapshot.
If the connection drops, the map doesn't silently miss whatever happened while it was out. It reconnects automatically, and while it's doing so it shows a "Reconnecting…" notice so you know the stream is briefly down. On reconnect it passes ?since=<ISO> with the timestamp it last heard from, and the server replays every session touched during the gap. The client dedupes by session id and timestamp, so a replayed event you already saw doesn't double-apply. A dropped connection doesn't leave you with a stale map.
sequenceDiagram
    participant M as Map in your browser
    participant S as Utter server
    M->>S: GET /api/w/utter/agents/stream
    S-->>M: session.updated frames as work moves
    Note over M: patches one node per frame
    M--xS: connection drops
    M->>S: reconnect with ?since=last timestamp
    S-->>M: replays every session touched in the gap
    Note over M: dedupes by session id and timestamp
Now the honest limit, because it shapes how much you trust the stream. Delivery is best-effort over an in-process bus, and the database is the source of truth. The ?since replay plus dedupe on reconnect is what makes that reliable in practice, not a guarantee of instant delivery independent of it. This runs in-process today; Redis is named as a future scaling seam, not shipped multi-node fan-out. On a single node this is exactly what you want. Just don't build a mental model where the stream is a hard real-time guarantee across a cluster. It's a fast, self-healing view backed by a DB that always has the real answer.
Pulling the same sessions from a script
The sessions the map draws are also available over the REST API, which is handy when you want the "is anything stuck" check in a Slack bot or a morning cron instead of a browser tab. GET /v1/workspaces/{slug}/agent-sessions lists recent sessions and takes state, agent_id, issue_key, and limit as filters. It needs an API key with the agents:read scope.
Asking "which sessions are blocked on a human right now" looks like this:
curl "https://utter.ae/api/v1/workspaces/utter/agent-sessions?state=needs_input" \
  -H "Authorization: Bearer $UTTER_API_KEY"
const res = await fetch(
"https://utter.ae/api/v1/workspaces/utter/agent-sessions?state=needs_input",
{ headers: { Authorization: `Bearer ${process.env.UTTER_API_KEY}` } },
);
const { data } = await res.json();
for (const s of data) console.log(s.agent_name, s.issue_key, s.note);import os
import requests
res = requests.get(
"https://utter.ae/api/v1/workspaces/utter/agent-sessions",
params={"state": "needs_input"},
headers={"Authorization": f"Bearer {os.environ['UTTER_API_KEY']}"},
)
for s in res.json()["data"]:
print(s["agent_name"], s["issue_key"], s["note"])Each session in the response carries the same facts a map node shows: agent_name, state, title, note, external_url, issue_key, started_at, last_activity_at, and ended_at. The map is the human view of that data; the endpoint is the machine view.
Expanding, collapsing, filtering, and navigating
Once you can read the map, the rest is moving around it. A few controls do the work.
Expand all and Collapse all open or close the whole tree at once. Collapse all is disabled when nothing is expanded, so the button state itself tells you whether there's anything to collapse. For finer control, click any parent node to toggle just that branch open or closed. When a parent is collapsed and has hidden children, it wears a "+N" badge so you know how much is tucked underneath, say a project node showing +4 for four agents you haven't expanded.
Filter the map is the box you'll reach for most on a busy workspace. Type into it and matching branches auto-open so you see the hits without hand-expanding, and the view refits once the filter settles. Session and task nodes that don't match dim out rather than vanish, so you keep the surrounding structure for context while the matches stand out.
Clicking a leaf navigates. A session or assignment node with an issue behind it opens that issue when you click it. A project node opens that project's board. So the map isn't a dead diagram, it's a launcher. See a stalled session on WEB-42, click it, land on the ticket. A session node also carries an up-right arrow icon that opens the agent's external work link (a PR or a run URL) in a new tab, so you can jump straight to the actual pull request or run log the agent produced.
For getting around the canvas: pan by dragging, zoom by scrolling, and use the MiniMap (pannable and zoomable) plus the zoom Controls to move around a large tree. The background is a dotted grid. At low zoom, nodes render in a compact form, dropping their badges and notes so the overall shape stays legible when you're zoomed out to see everything. Top-right there's an export-image button that saves the current map as an image, handy for dropping into a standup doc or a status update.
Two honest notes on interaction. There are no keyboard shortcuts specific to the Agent Map. It's all mouse and pointer: click nodes, drag to pan, scroll to zoom, use the controls. Don't hunt for a hotkey that isn't there. And if you drag an individual node around, that only repositions it visually on the canvas. It does not reassign work or change any data. Move a node wherever it's comfortable to look at; nothing about the underlying agent or task changes.
Limits and mistakes to avoid
Everything the map deliberately doesn't do, in one place, so you never fight it expecting otherwise.
It's one batch, up to 25 agents. Agents are capped at 25 per workspace, which is exactly why the whole map loads in a single batch with no lazy-loading of agents. You're never waiting on agents to page in.
The renderer caps at 900 nodes. Beyond that, the tree truncates and shows "Showing the first slice. Filter to narrow it down." That's your cue to use the filter box rather than expect an unlimited canvas. On a full workspace with many projects and many live sessions, you narrow with the filter, not scroll forever.
Single workspace only. Not org-wide, not cross-workspace. One workspace's team.
Active work only. Done and cancelled sessions are hidden; failed stays visible on purpose. This is not a session history log. If you need the full record of everything an agent has ever run, that lives elsewhere.
The dot is an aggregate, not a session. Attention beats running beats review beats failed beats idle. One color for the whole agent. Don't read it as one session's state.
Assigned is not a run. A dimmed "Assigned" item is a queued issue with no session yet. It tells you what's next, not what's live.
Stalled is a heuristic. Running or pending with no activity for 30-plus minutes, re-derived on the client every 30 seconds. It's a hint that an agent has gone quiet, not a stored state and not a hard failure.
The "Unverified" badge is not on the map. That badge, which flags a review or done session with no attributed activity on its issue, lives on the Agents hub List and the issue-activity surfaces, not as a control on the map. Don't go looking for it here.
So when do you reach for which? Use the List when you're managing the roster: connecting an agent, checking a key, reading the Unverified badge, confirming who's set up. Use the Map when you're managing the work: is anything stuck, who owns the failure, which project is overloaded, what's actually moving. The list is the setup surface. The map is the situational-awareness surface.
If you're building up your agent team, the map makes more sense once the surrounding pieces are in place. Managing a team of AI agents covers the whole operating model. Delegating work to an agent is how those Assigned and session nodes land on the map in the first place. Setting agent field permissions is worth reading before you hand agents write access to issues. And if the radial layout feels familiar, the Mindmap uses the same engine for your issues and projects.
Frequently asked questions
Where do I find the Agent Map in Utter?
Go to the Agents hub at /w/<workspace>/agents, then click the Map link in the List / Map toggle in the page header. That takes you to /w/<workspace>/agents/map. The active tab in the toggle is filled with brand gold, so you can always tell which view you're on.
How do I see what all my AI agents are working on right now?
Open the Agent Map and expand an agent branch. It opens to its projects and current work items, and every session node shows the issue title, issue key, the agent's live note, and a state pill like Running or In review. The workspace root also shows a live count of how many agents are running right now.
What do the colored dots on each agent mean?
The dot is the agent's aggregate status: cyan and pulsing is running, orange is attention (needs input or stalled), yellow is in review, pink is failed, grey is idle. When an agent is doing several things at once, attention wins over running, then review, then failed, then idle, so a blocked agent reads orange even if another of its sessions is still running.
How can I tell which team member owns a specific AI agent?
Switch the mode control to By owner. The tree then nests Workspace to Owner to Agent to Project to Task, so each person shows the agents they own and what those agents are doing. Owner nodes also show the owner's avatar.
How does Utter know an agent is stalled?
It's a time-based heuristic. A session that's running or pending with no activity for over 30 minutes gets an orange "Stalled" pill, and the agent's dot flips to attention orange. A client-side clock re-checks this every 30 seconds, so an agent can go stale on your screen without any new server event. Stalled is derived, not a stored session state.
Does the Agent Map update in real time, or do I have to refresh?
It updates live over a Server-Sent-Events stream and patches the changed node in place, no reload needed. If the connection drops it shows a "Reconnecting…" notice, then reconnects and replays anything it missed so nothing is lost. Delivery is best-effort with the database as the source of truth, which the replay-on-reconnect covers.
How many agents can the Agent Map show at once?
Up to 25 agents per workspace, which is the workspace cap, so the whole map loads in one batch. The renderer also caps total visible nodes at 900; past that it truncates and shows "Showing the first slice. Filter to narrow it down," so you use the filter box to narrow the view.
What's the difference between an "Assigned" item and a running session on the map?
An "Assigned" item is an open issue assigned to an agent that has no session yet, shown dimmed at 40% opacity with an "Assigned" pill. A running session is live work, shown at full brightness with a state pill and the agent's note. Assigned tells you what's queued; a session tells you what's actually happening.
Related reading

How to manage a team of AI agents without losing track of what they're doing
Running several AI agents at once? The day-to-day of a fleet: a roster, live sessions, instant delegation, per-field permissions, and verified work.
July 15, 2026 · 16 min read
How to connect an ai agent
Connect an AI agent to a project management tool in Utter: name it, mint a scoped key, wire up MCP, assign a ticket, and watch its sessions, step by step.
July 15, 2026 · 15 min read
How to use AI agents in Utter: connect them, assign work, and follow their sessions
A start-to-finish walkthrough: connect an agent, scope its key, assign it issues, and watch its sessions, without giving up control of the board.
July 15, 2026 · 11 min read
How to use the mindmap
How to use Utter's project mind map view: open the radial tree, read the pills, expand and filter branches, group by Hierarchy/Status/People, and export a PNG.
July 15, 2026 · 14 min read
AI agent project management: the complete guide
How to run real projects with AI agents on the board: connecting them, assigning work, keeping review, what breaks, and how to pilot it in a week.
July 15, 2026 · 12 min read
See your whole project as a mind map (and when it beats a nested list)
A nested list hides how work relates. A mind map shows it. When a map of your epics and stories helps, when a list is better, and how Utter's does it.
July 5, 2026 · 7 min read
Onboard an AI agent like a new hire: identity, access, and a first task
You already know how to bring on a new hire. Do the same for an AI agent: give it an identity, scoped access, one small task, a review, and an offboarding path.
July 15, 2026 · 8 min read
What is agentic project management? A plain-language guide with a working example
A copilot waits for your prompt. An agent acts on an event. Here is the perceive-plan-act-check loop explained, with one real end-to-end run inside Utter.
June 11, 2026 · 11 min read

How to tell when an AI agent is stuck (and what to do about it)
A looping, waiting, or hung agent looks exactly like a working one. Here is how to get a real signal on an agent's live state and catch stuck runs.
July 15, 2026 · 7 min read
Keep an audit trail of everything your AI agents change
Once agents can write to your tracker, a shared bot account makes every change anonymous. Here is how per-agent identity keeps the trail readable.
July 15, 2026 · 8 min read
Add a comment
Start the conversation.